Generative AI has been a game-changer in many industries, especially marketing but it’s not just a shortcut to writing articles. In fact, it is a common mistake (and a crying shame) that everyone is using it this way.
The most well known implementation of the GPT-n series language model is ChatGPT – you know the one everyone is talking about!
If you don’t know, ChatGPT is a language model powered by OpenAI, capable of generating human-like text output by responding to prompts. Currently, it is relatively easy to spot if content is written by generative AI – I wrote an article about this here earlier in the year.
But even when the technology develops to overcome these issues I still feel that the real power will be not in replacing humans as content writers by turning everyone in a Marketing role into a prompt engineer, but in how generative AI can make marketers (and workers in other industries) more productive.
Understanding ChatGPT in Marketing Planning
Generative AI is a powerful tool for a range of operational Marketing tasks like Generating Data-Driven Insights which is critical for developing effective strategies ChatGPT can analyze huge amounts of data, in seconds, and help you generate actionable insights. The same level of Analysis can be done to help you dig into audience segmentation, understand your customer journey, and identify potential bottlenecks and areas of improvement. But there are some pretty big limitations to be aware of. The most obvious being its lack of contextual understanding. ChatGPT is great at sorting data but it will struggle to comprehend nuanced or context-heavy questions so the responses are often at best overly generic or at worst miss the mark completely. Not to mention the fact that it sometimes just makes things up, because those words go well together. As marketers, we must recognise these limitations and make sure to frame questions (Prompts) in a way that gets useful responses. As with everything ‘data’ if you want great output, you need great input (GIGO – Garbage In Garbage Out).
But one thing that reduces the usefulness of ChatGPT output is that it just gives you words, the predictable layout of school-level essay structure; intro, point one, point two, conclusion. You can ask ChatGPT to output tables which can be useful especially if sorting data, but it can’t give you diagrams. (Ok there is Midjourney and other tools for images, but that is different altogether)
However, I read a post on LinkedIn recently -Can’t find it now to link, sorry – you can prompt ChatGPT to output in a specific syntax and paste it directly into other tools, like Mermaid diagrams, where you can create visually engaging and easy-to-understand flowcharts and diagrams.
Mermaid is a text-based diagramming tool written in JavaScript that can create various flowcharts, sequence diagrams, Gantt charts, and more using a simple syntax. It seamlessly integrates with markdown and other text-based documents. And ChatGPT can produce correctly formatted output from the instructions you input.
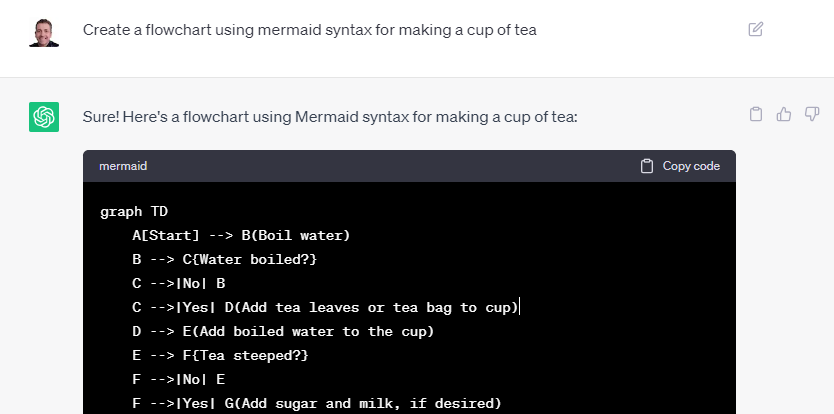
Ok this is a silly example, but I asked chatGPT to “Create a flowchart using mermaid syntax for making a cup of tea” and this is what I got
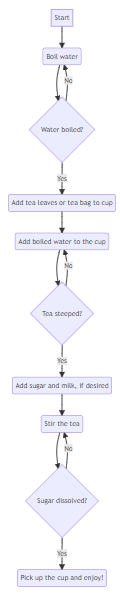
And this is the result after pasting it into Mermaid
But can we get it do do something more useful?
Ok not bad…
ok getting better and frankly more useful!
Getting a GPT powered HeadStart
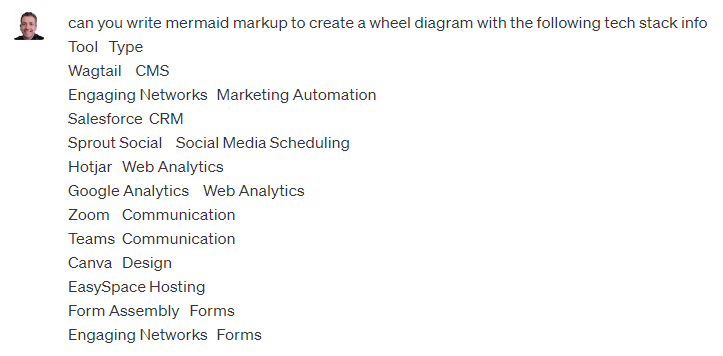
So… I gave chatGPT some basic data about software tech stack used in an organisation. It was a google sheet, but rendered like this (below) when I posted it into ChatGPT. (I thought I wanted a wheel diagram so that is what I asked for)
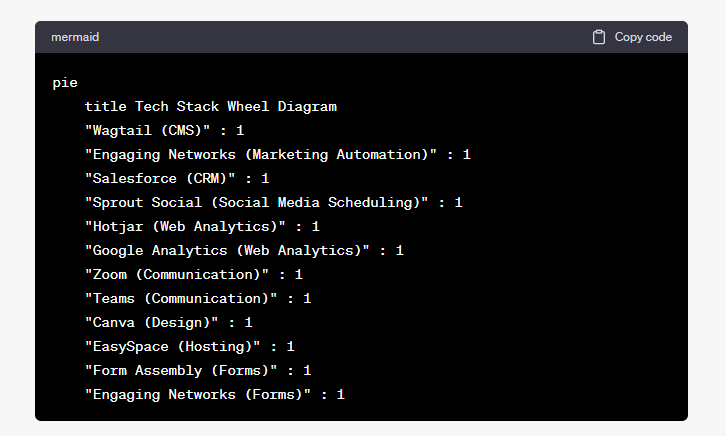
ChatGPT wanted to give me a pie chart (kind of wheel-like!!) but the output wasn’t great as each tool was 8% – but I liked how ChatGPT was able to put the type into parenthesis and sort it – but not what I was looking for at all…
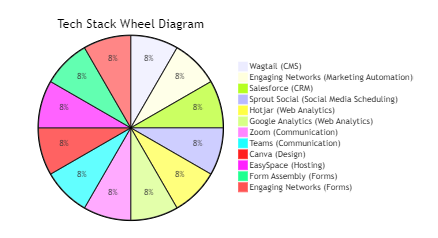
Not terribly useful!
So I tried a few more times – ChatGPT through up some erroneous code- but when I told it – it fixed it straight away – we went back and forward a bit until I convinced myself that a flowchart was good (lol) Then I hit another stumbling block – getting exactly what I wanted was hard!
Accelerated Learning
I wanted to edit bits in a certain way and each time – ChatGPT just gave me something else. but then I realised something. Even though I have never tried to program anything in Mermaid before – ChatGPT had given me the code – it took me mere seconds to look at the code and work out which parts to change to get what I wanted!
graph TD
    subgraph CMS
        Wagtail
    end
    subgraph Marketing_Automation
        Engaging_Networks
    end
    subgraph CRM
        Salesforce
    end
    subgraph Social_Media_Scheduling
        Sprout_Social
    end
    subgraph Web_Analytics
        Hotjar
        Google_Analytics
    end
    subgraph Communication
        Zoom
        Teams
    end
    subgraph Design
        Canva
    end
    subgraph Hosting
        EasySpace
    end
    subgraph Forms
        Form_Assembly
        Engaging_Networks_Forms
    end

    Wagtail -->|CMS| EasySpace
    Engaging_Networks -->|Marketing Automation| Salesforce
    Sprout_Social -->|Social Media Scheduling| Google_Analytics
    Hotjar -->|Web Analytics| Teams
    Zoom -->|Communication| Canva
    Form_Assembly -->|Forms| Engaging_Networks_Forms
I had learned mermaid syntax, without reading a guide, blog, or watching a YouTube video. ChatGPT had given me the basic code to create what I wanted and I was able to learn it just by a 30-second look – Admittedly, Mermaid is a really simple syntax.
- Objects at the top
- Connections underneath with –> as arrows and |as labels|
I tried <– It didn’t work (You have to change the word order)
I tried <–> it worked
So I suddenly knew how to write the syntax, in a way that felt really passive, really low effort.
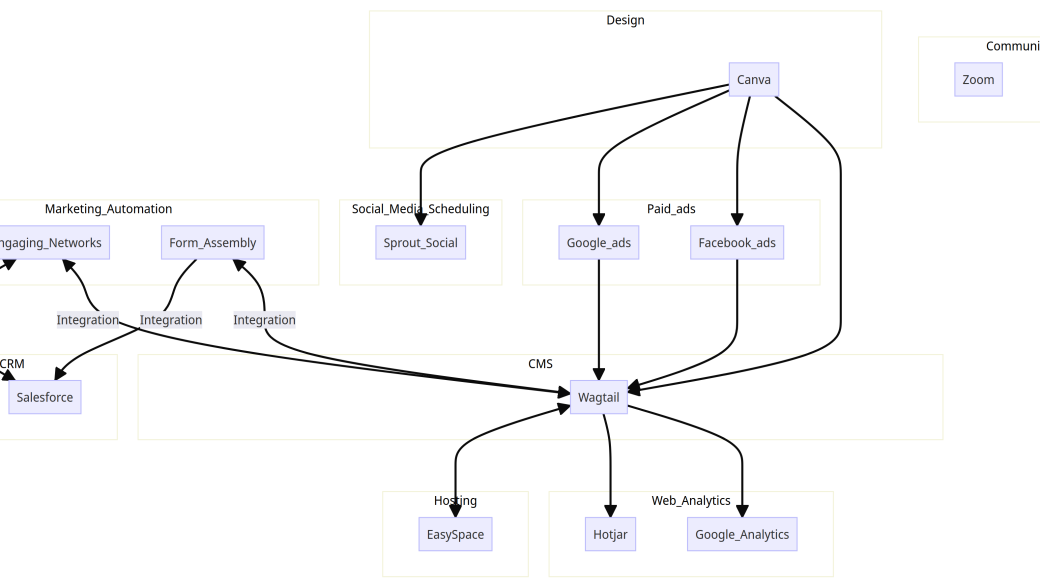
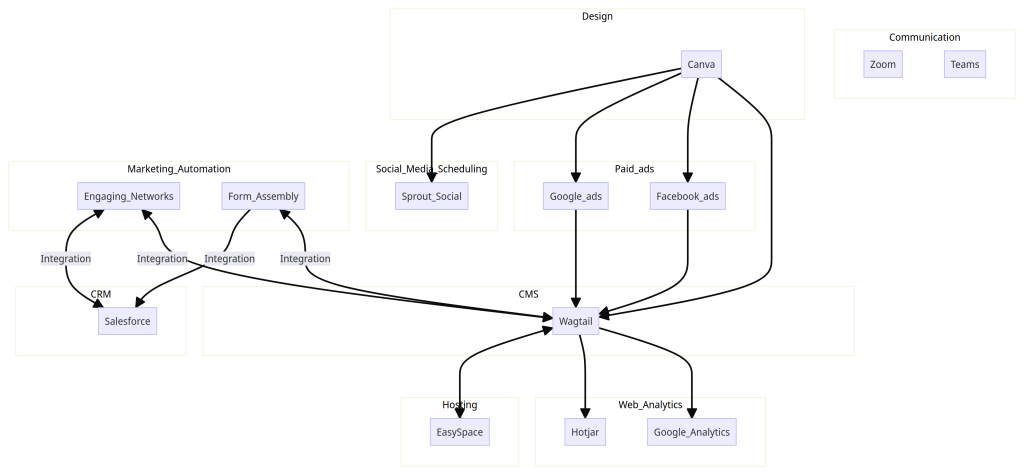
This is my final code
graph TD
subgraph Social_Media_Scheduling
        Sprout_Social
    end
    subgraph Web_Analytics
        Hotjar
        Google_Analytics
    end
    subgraph Communication
        Zoom
        Teams
    end
    subgraph Design
        Canva
    end
    subgraph Paid_ads
        Google_ads
        Facebook_ads
    end
    subgraph Marketing_Automation
        Engaging_Networks
                Form_Assembly
    end
    subgraph CRM
        Salesforce
    end
subgraph CMS
        Wagtail
    end
subgraph Hosting
        EasySpace
    end

    Wagtail <--> EasySpace
    Engaging_Networks <--> |Integration| Salesforce
    Form_Assembly --> |Integration| Salesforce
Google_ads --> Wagtail
Facebook_ads --> Wagtail
Canva --> Sprout_Social
Wagtail --> Hotjar
Wagtail --> Google_Analytics
Canva --> Google_ads
Canva --> Facebook_ads
Form_Assembly <--> |Integration| Wagtail
Engaging_Networks <--> |Integration| Wagtail
Canva --> Wagtail
And this is my final diagram, which actually works for me to visualise the new tools and how they are related.
Visualizing Marketing Strategies with Mermaid
One of the key challenges in presenting marketing campaign proposals is effectively conveying complex strategies, often to people with no marketing background or context of the target audience. Using this approach with CHat GPT and Mermaid I can quickly create a concise and structured way to illustrate strategies, dependencies and timelines in the form of flowcharts, and other diagrams to make it easier for stakeholders to grasp the concepts.
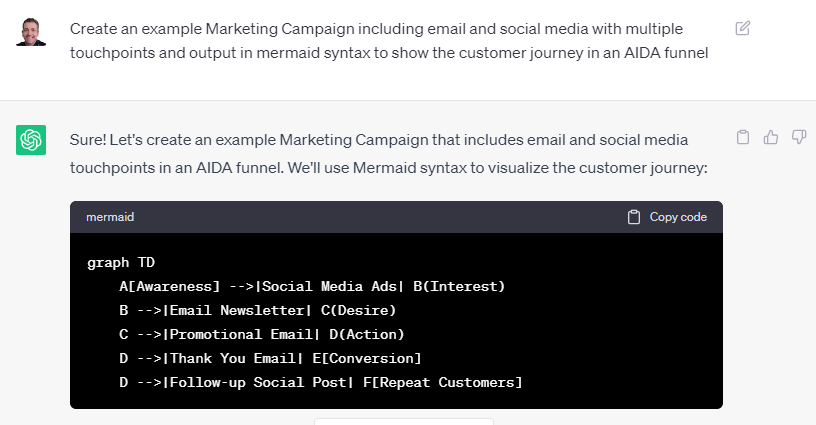
Visualising the Customer Journey
A flowchart can depict the customer journey, outlining the steps from awareness to conversion. I can represent the various touchpoints, decision-making processes, and interactions, in Mermaid, allowing everyone to visualize the campaign’s structure.
Content Strategy
You could use GPT or other LLM to draft engaging content ideas and strategies. And transform them using Mermaid into a flowchart to display content creation and distribution plans. Or use a Mermaid flowchart to show the ideation process, content formats, publication schedule, and social media sharing plan.
Building Social Media Campaigns
Use a Mermaid sequence diagram to visualize the timeline of social media posts, the channels, required assets and dependencies
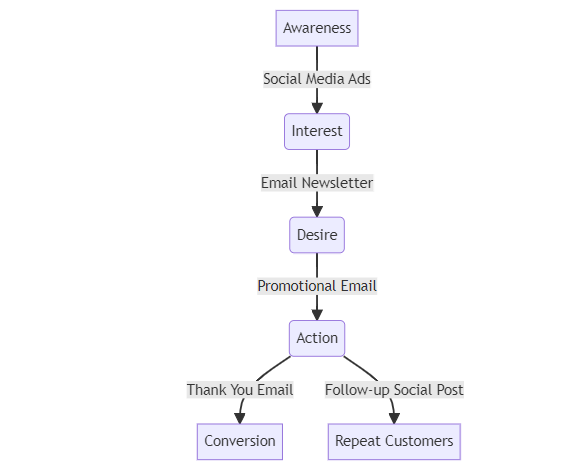
Visualizing Marketing Funnels
ChatGPT can explain the different stages of the funnel, and Mermaid can help visualize this journey by using the Mermaid syntax to create a flowchart that illustrates each stage of the funnel, the audience’s actions, and expected outcomes.
14 Replies to “How to Create Awesome Diagrams in ChatGPT and Mermaid”
Comments are closed.